In today’s data-driven world, the ability to transform raw data into actionable insights is a valuable skill. Tableau, a leading data visualization tool, has emerged as a powerhouse in this realm, allowing users to create dynamic and interactive visualizations. In this comprehensive guide, we will delve into How to Use Tableau to Visualize Data, providing step-by-step instructions and insights to help you harness the full potential of this powerful tool.
How to Use Tableau to Visualize Data
Understanding Tableau Basics
Understanding Tableau Basics: How to Use Tableau to Visualize Data
Before diving into the specifics of data visualization, it’s crucial to familiarize yourself with Tableau’s interface and basic functionalities. Learn about the different components, including the Data Source tab, Data Pane, and the Worksheet, where the actual visualizations take shape. Understanding how to navigate Tableau’s environment sets the stage for effective data visualization.
Connecting to Data Sources
Tableau supports a wide range of data sources, from spreadsheets and databases to cloud-based services. Explore the process of connecting Tableau to your data source, whether it’s a local file, a database, or an online platform. Learn to manage data connections efficiently to ensure a seamless flow of information into your visualizations.
Data Preparation and Cleaning
Clean and well-organized data is the foundation of effective visualizations. Dive into Tableau’s data preparation tools to clean, filter, and shape your data appropriately. Explore techniques for handling missing values, creating calculated fields, and transforming data to suit your visualization goals.
Building Basic Visualizations
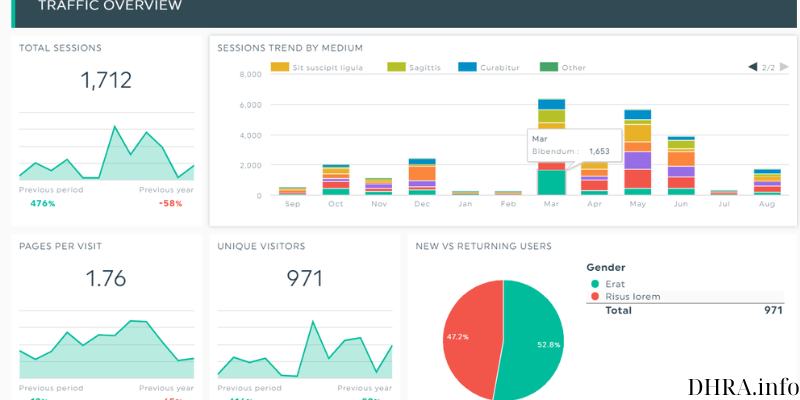
Tableau offers a diverse set of visualization types, from bar charts and scatter plots to maps and heatmaps. Learn how to create basic visualizations using your prepared data. Understand the nuances of each visualization type and when to use them for maximum impact. Customize your visualizations to convey insights effectively.
Advanced Visualization Techniques
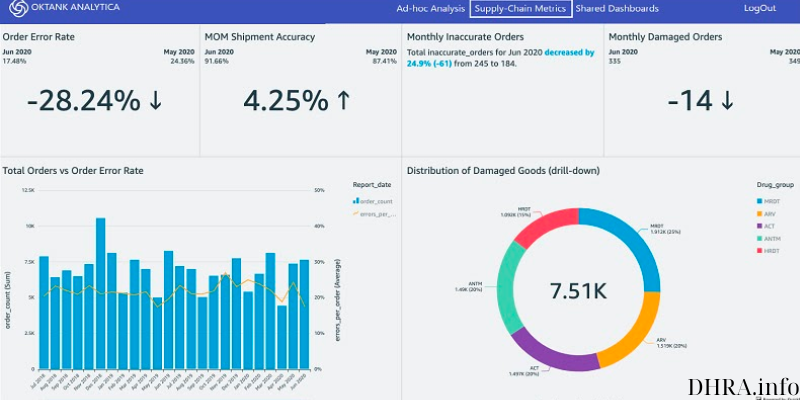
Take your Tableau skills to the next level by exploring advanced visualization techniques. Delve into features such as dual-axis charts, trendlines, reference lines, and parameters. Understand the power of storytelling through dashboards and learn how to combine multiple visualizations into a cohesive and compelling narrative.
Implementing Interactivity
Implementing Interactivity: How to Use Tableau to Visualize Data
One of Tableau’s strengths lies in its ability to create interactive dashboards. Learn how to implement interactivity by incorporating filters, highlight actions, and URL actions. Enable users to explore the data dynamically and gain insights tailored to their specific interests.
Utilizing Tableau Calculations
Tableau’s calculation features allow for complex data manipulations and custom calculations. Explore the use of calculated fields, table calculations, and LOD (Level of Detail) expressions. Understand how to leverage these calculations to derive meaningful insights and enhance the depth of your visualizations.
Mapping and Spatial Analysis
Tableau excels in spatial analysis and mapping. Discover how to create map visualizations, geocoding, and spatial calculations. Uncover the potential of geographical data to provide context and additional layers of information to your visualizations.
Publishing and Sharing
Once your visualizations are ready, the next step is to share them with your audience. Learn how to publish your Tableau workbooks to Tableau Server or Tableau Online. Understand the different sharing options, including embedding visualizations in websites or exporting them as static images or PDFs.
Continuous Learning and Community Engagement
Tableau’s community is a vibrant ecosystem of users, experts, and resources. Explore the Tableau Public platform for sharing visualizations and gaining inspiration from others. Engage with forums, attend Tableau events, and stay updated on new features and best practices to continue refining your Tableau skills.
Advanced Tableau Features
Explore some of Tableau’s advanced features that can elevate your data visualization game. This includes integrating R and Python scripts for advanced analytics, utilizing forecasting capabilities, and incorporating statistical functions. Learn how to leverage these features to add depth and sophistication to your visualizations, making them more insightful and impactful.
Tableau Server Administration
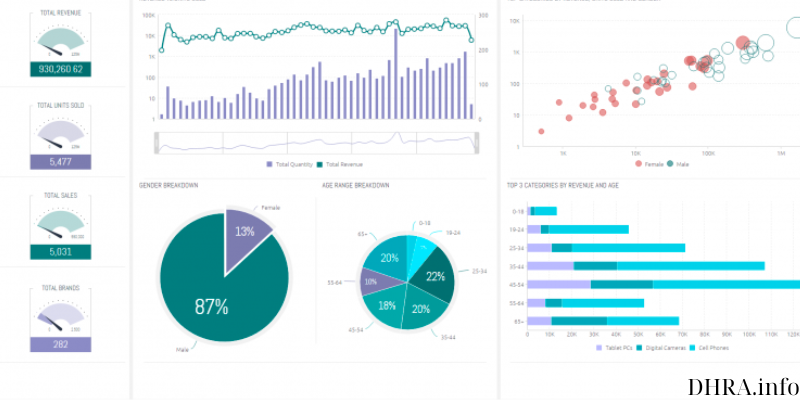
Tableau Server Administration: How to Use Tableau to Visualize Data
If you are working in a collaborative environment or want to share your Tableau visualizations securely, understanding Tableau Server administration is crucial. Learn the basics of Tableau Server, including user management, permissions, and content organization. This knowledge is essential for deploying Tableau solutions in a corporate setting.
Data Blending and Joins
In real-world scenarios, data often resides in multiple sources. Tableau allows you to blend data from different sources and perform joins to create a unified dataset. Understand the nuances of data blending and joining to bring together disparate datasets seamlessly, providing a comprehensive view for more holistic insights.
Customizing Tableau Dashboards
Tableau offers a high degree of customization for dashboards. Learn how to format your dashboards effectively, choose color schemes, and control layout spacing. Explore the use of containers and layout containers to organize your visualizations strategically, ensuring a polished and professional appearance.
Conclusion
Mastering Tableau for data visualization is a journey that involves understanding its features, honing your visualization techniques, and staying connected with a dynamic community. This comprehensive guide has provided a roadmap for harnessing Tableau’s power to transform data into meaningful insights. With the right skills and knowledge, you can unlock the full potential of Tableau and create visualizations that drive informed decision-making in the ever-evolving landscape of data analytics.