In today’s data-driven world, organizations are flooded with a wealth of information. To make sense of this data and extract actionable insights, data visualization dashboards have become indispensable tools. These dashboards serve as dynamic interfaces that enable users to interact with data, transforming raw numbers into insightful visuals. In this article, we’ll delve into the world of data visualization dashboards, exploring their significance, components, design principles, and the impact they have on informed decision-making.
I. The Significance of Data Visualization Dashboards
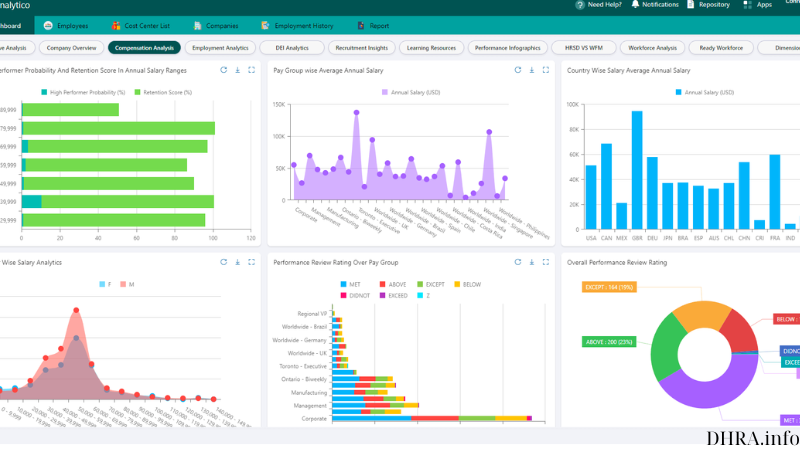
The Significance of Data Visualization Dashboards
Data visualization dashboards are a vital component of modern business intelligence and analytics strategies. They empower organizations to unlock the hidden potential of their data, driving better decision-making and improved outcomes. Here are some key reasons why data visualization dashboards are significant:
- Accessible Information: Dashboards provide a consolidated view of data, making it easily accessible to decision-makers. Instead of sifting through spreadsheets and reports, users can obtain insights at a glance.
- Real-Time Insights: Many dashboards can display real-time or near-real-time data, allowing organizations to respond quickly to changing circumstances and market conditions.
- Interactive Data Exploration: Dashboards offer interactivity, enabling users to explore data, filter information, and drill down to specific details. This promotes a deeper understanding of the data.
- Improved Communication: Visualizations make complex data more understandable. By presenting information graphically, dashboards facilitate clear communication and knowledge sharing among team members.
- Data-Driven Decisions: Informed decisions are based on data, and dashboards provide the data needed to make critical choices, whether in marketing, finance, operations, or any other domain.
II. Components of Data Visualization Dashboards
A well-designed data visualization dashboard comprises several key components that work together to provide a comprehensive view of data. These components include:
- Data Sources: Dashboards pull data from various sources, such as databases, spreadsheets, APIs, and cloud services. The quality and integrity of the data source are crucial for accurate insights.
- Visualization Widgets: These are the building blocks of a dashboard and include charts, graphs, tables, and maps. Different types of widgets are used to represent data in a way that aligns with the objectives of the dashboard.
- Filters and Parameters: Filters and parameters allow users to interact with the data. They can adjust time frames, select specific categories, and apply filters to customize the view according to their needs.
- Key Performance Indicators (KPIs): KPIs are important metrics or benchmarks that help users quickly gauge the performance of a specific aspect of the business. KPIs are often displayed prominently on dashboards.
- Dashboards Layout: The layout of the dashboard is a crucial design consideration. It involves arranging widgets, filters, and KPIs in an intuitive and visually appealing manner. A clean and organized layout ensures ease of use.
- Data Integration: Integrating data from various sources is essential for a comprehensive view. Effective integration ensures that the dashboard provides a holistic picture of the business.
III. Design Principles for Effective Data Visualization Dashboards
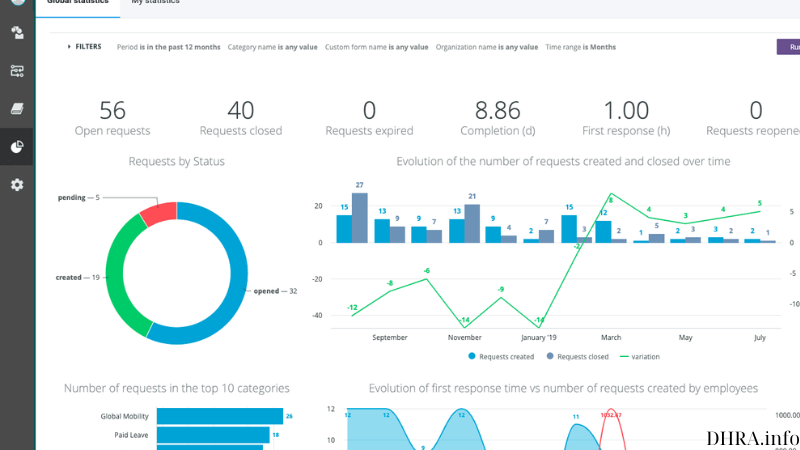
Design Principles for Effective Data Visualization Dashboards
Creating a data visualization dashboard that effectively conveys information and insights requires careful consideration of design principles. Here are some key design principles to keep in mind:
- Understand the Audience: Tailor the dashboard to the needs of the audience. Different user groups may require different types of information and visualizations.
- Simplicity: Keep the dashboard simple and uncluttered. Avoid unnecessary distractions or excessive information that can overwhelm users.
- Consistency: Maintain a consistent design style, color scheme, and layout throughout the dashboard to ensure a cohesive and professional appearance.
- Use Visual Hierarchy: Organize elements in order of importance, with critical information placed prominently. The use of different sizes, colors, and emphasis can guide users’ attention.
- Responsiveness: Ensure the dashboard is responsive to different devices and screen sizes. Users should be able to access and interact with the dashboard on mobile devices, tablets, and desktops.
- Data Accuracy: Accuracy is paramount. Ensure that data is up-to-date and reliable to avoid misleading users.
- Provide Context: Use text and annotations to provide context for the data visualizations. Explain the significance of the numbers and trends.
- Interactivity: Implement interactive features like drill-down capabilities, hover-over tooltips, and clickable elements to enhance user engagement and exploration.
IV. Types of Data Visualization Dashboards
Data visualization dashboards can take various forms, depending on the purpose and audience. Here are some common types of data visualization dashboards:
- Executive Dashboards: Designed for high-level executives and management, these dashboards focus on KPIs and key insights to aid strategic decision-making.
- Operational Dashboards: These dashboards are used by operational teams to monitor day-to-day activities, track performance, and address immediate issues.
- Analytical Dashboards: Geared towards data analysts and data scientists, these dashboards allow for in-depth data exploration and advanced analytics.
- Marketing Dashboards: Tailored for marketing professionals, these dashboards provide insights into campaign performance, customer behavior, and ROI.
- Sales Dashboards: Designed for sales teams, these dashboards track sales performance, pipeline, and forecasts.
- Financial Dashboards: Finance teams use these dashboards to monitor financial metrics, budgets, and cash flow.
- Healthcare Dashboards: In the healthcare sector, these dashboards track patient data, outcomes, and operational efficiency.
- Social Media Dashboards: Social media managers use these dashboards to analyze engagement, reach, and content performance on various platforms.
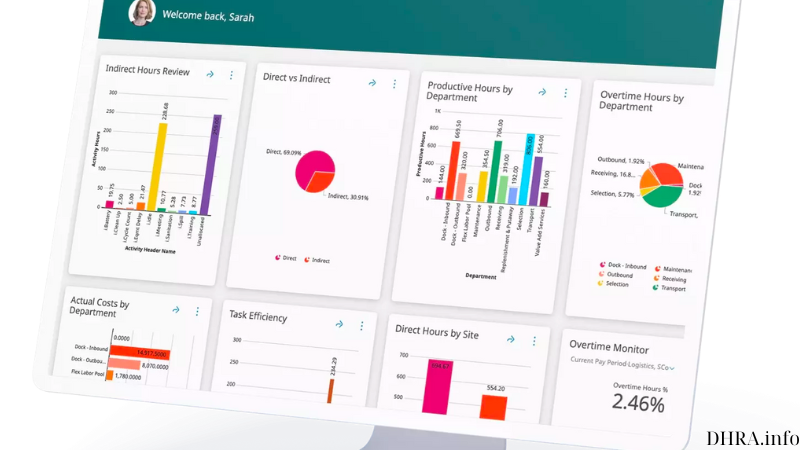
Types of Data Visualization Dashboards
Conclusion
Data visualization dashboards have evolved into indispensable tools for organizations seeking to harness the power of data for informed decision-making. They offer a consolidated, interactive, and visually engaging way to present data, making it accessible to a wide range of users, from executives to operational teams. By following design principles and utilizing various types of data visualization dashboards, organizations can unlock insights that drive better performance and outcomes. In an increasingly data-driven world, the ability to translate data into actionable insights is a competitive advantage that no organization can afford to ignore. Data visualization dashboards empower organizations to navigate the complex landscape of data, facilitating strategic decision-making and driving success in a rapidly changing business environment.